iCharts Product Reinvention
iCharts is a Business Intelligence reporting and analytics tool for Netsuite and Google Cloud platforms. As a lead product designer, my goal was to build a powerful and useful tool that beautifully visualizes and analyzes data in BigQuery. I helped the company redesign their end-to-end user flow, create new product feature concepts, and define the overall product interaction and UI elements.
My Role: Lead Product Designer, 2016-2017

Legacy Product Issues
The product had an outdated UI and it didn’t have the same design system as their marketing website. The inconsistent user interaction also caused user confusion which made the product hard to use. It creates steep learning curve especially for their first time users.
____

New Concept
A draft concept of how we wanted the core product interaction to be - as simple as drag-and-drop interaction with individual datasets. Any datasets on the left panel can be dragged into the areas where to be measures, labels or filters.
____

Iterative Design Process
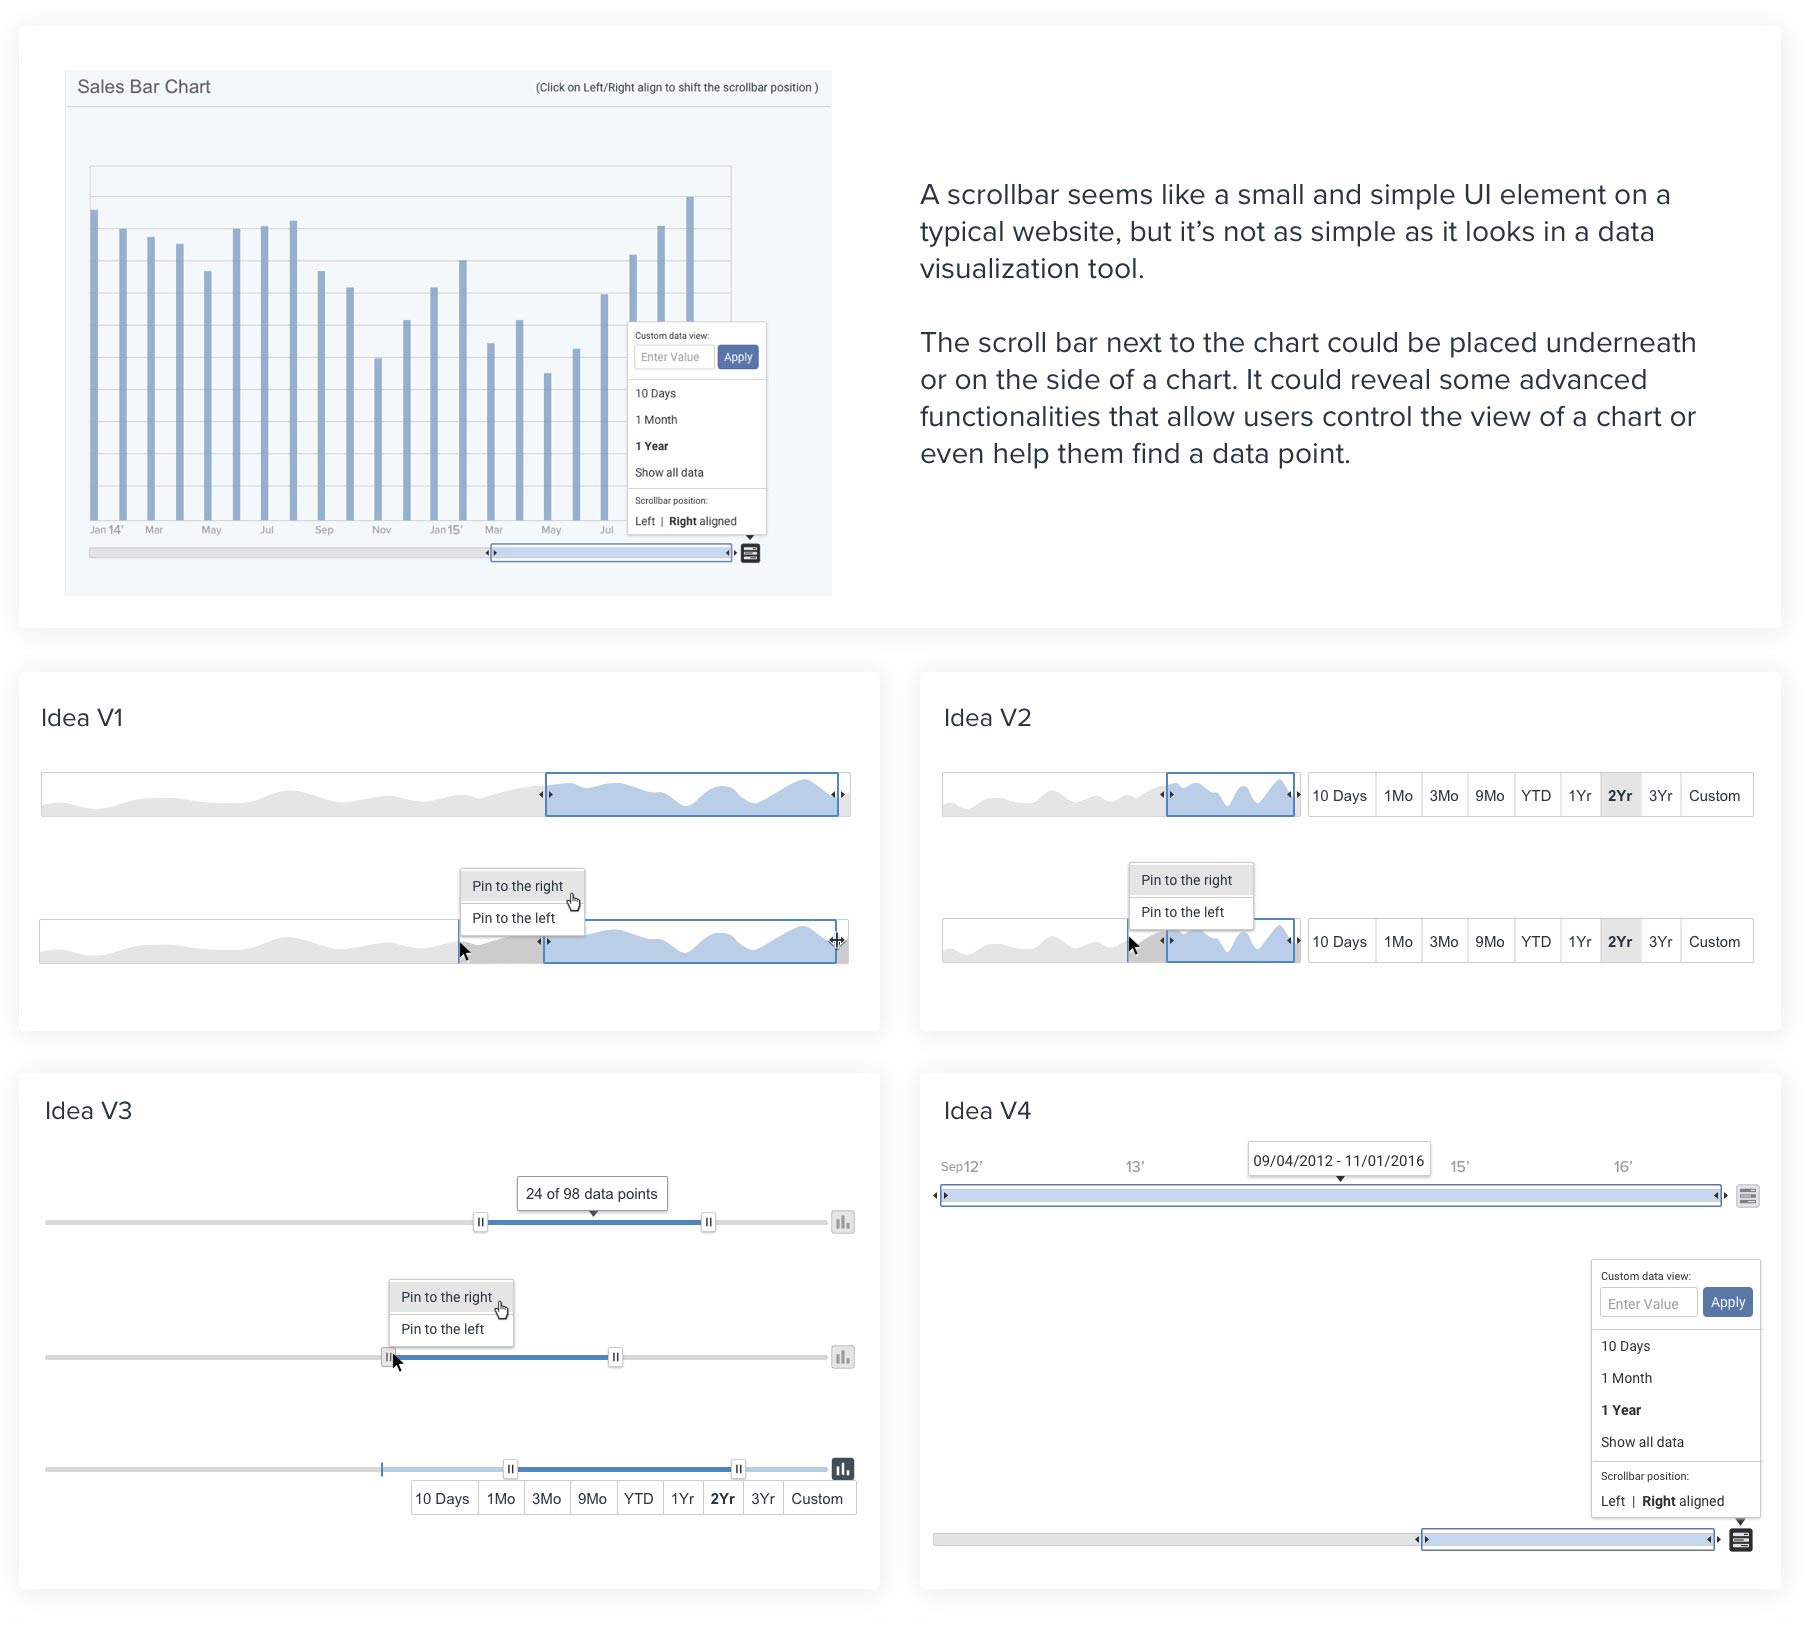
In the beginning of iCharts product redesign, I started with tactical tasks while learning more about the product itself. Scrollbar is one of the UI elements I worked on. It includes advanced functionalities for customers to change a chart’s view. I did some research on the design patterns and came up with a few ideas to be discussed with PMs and engineers.
____

End to End User Flow
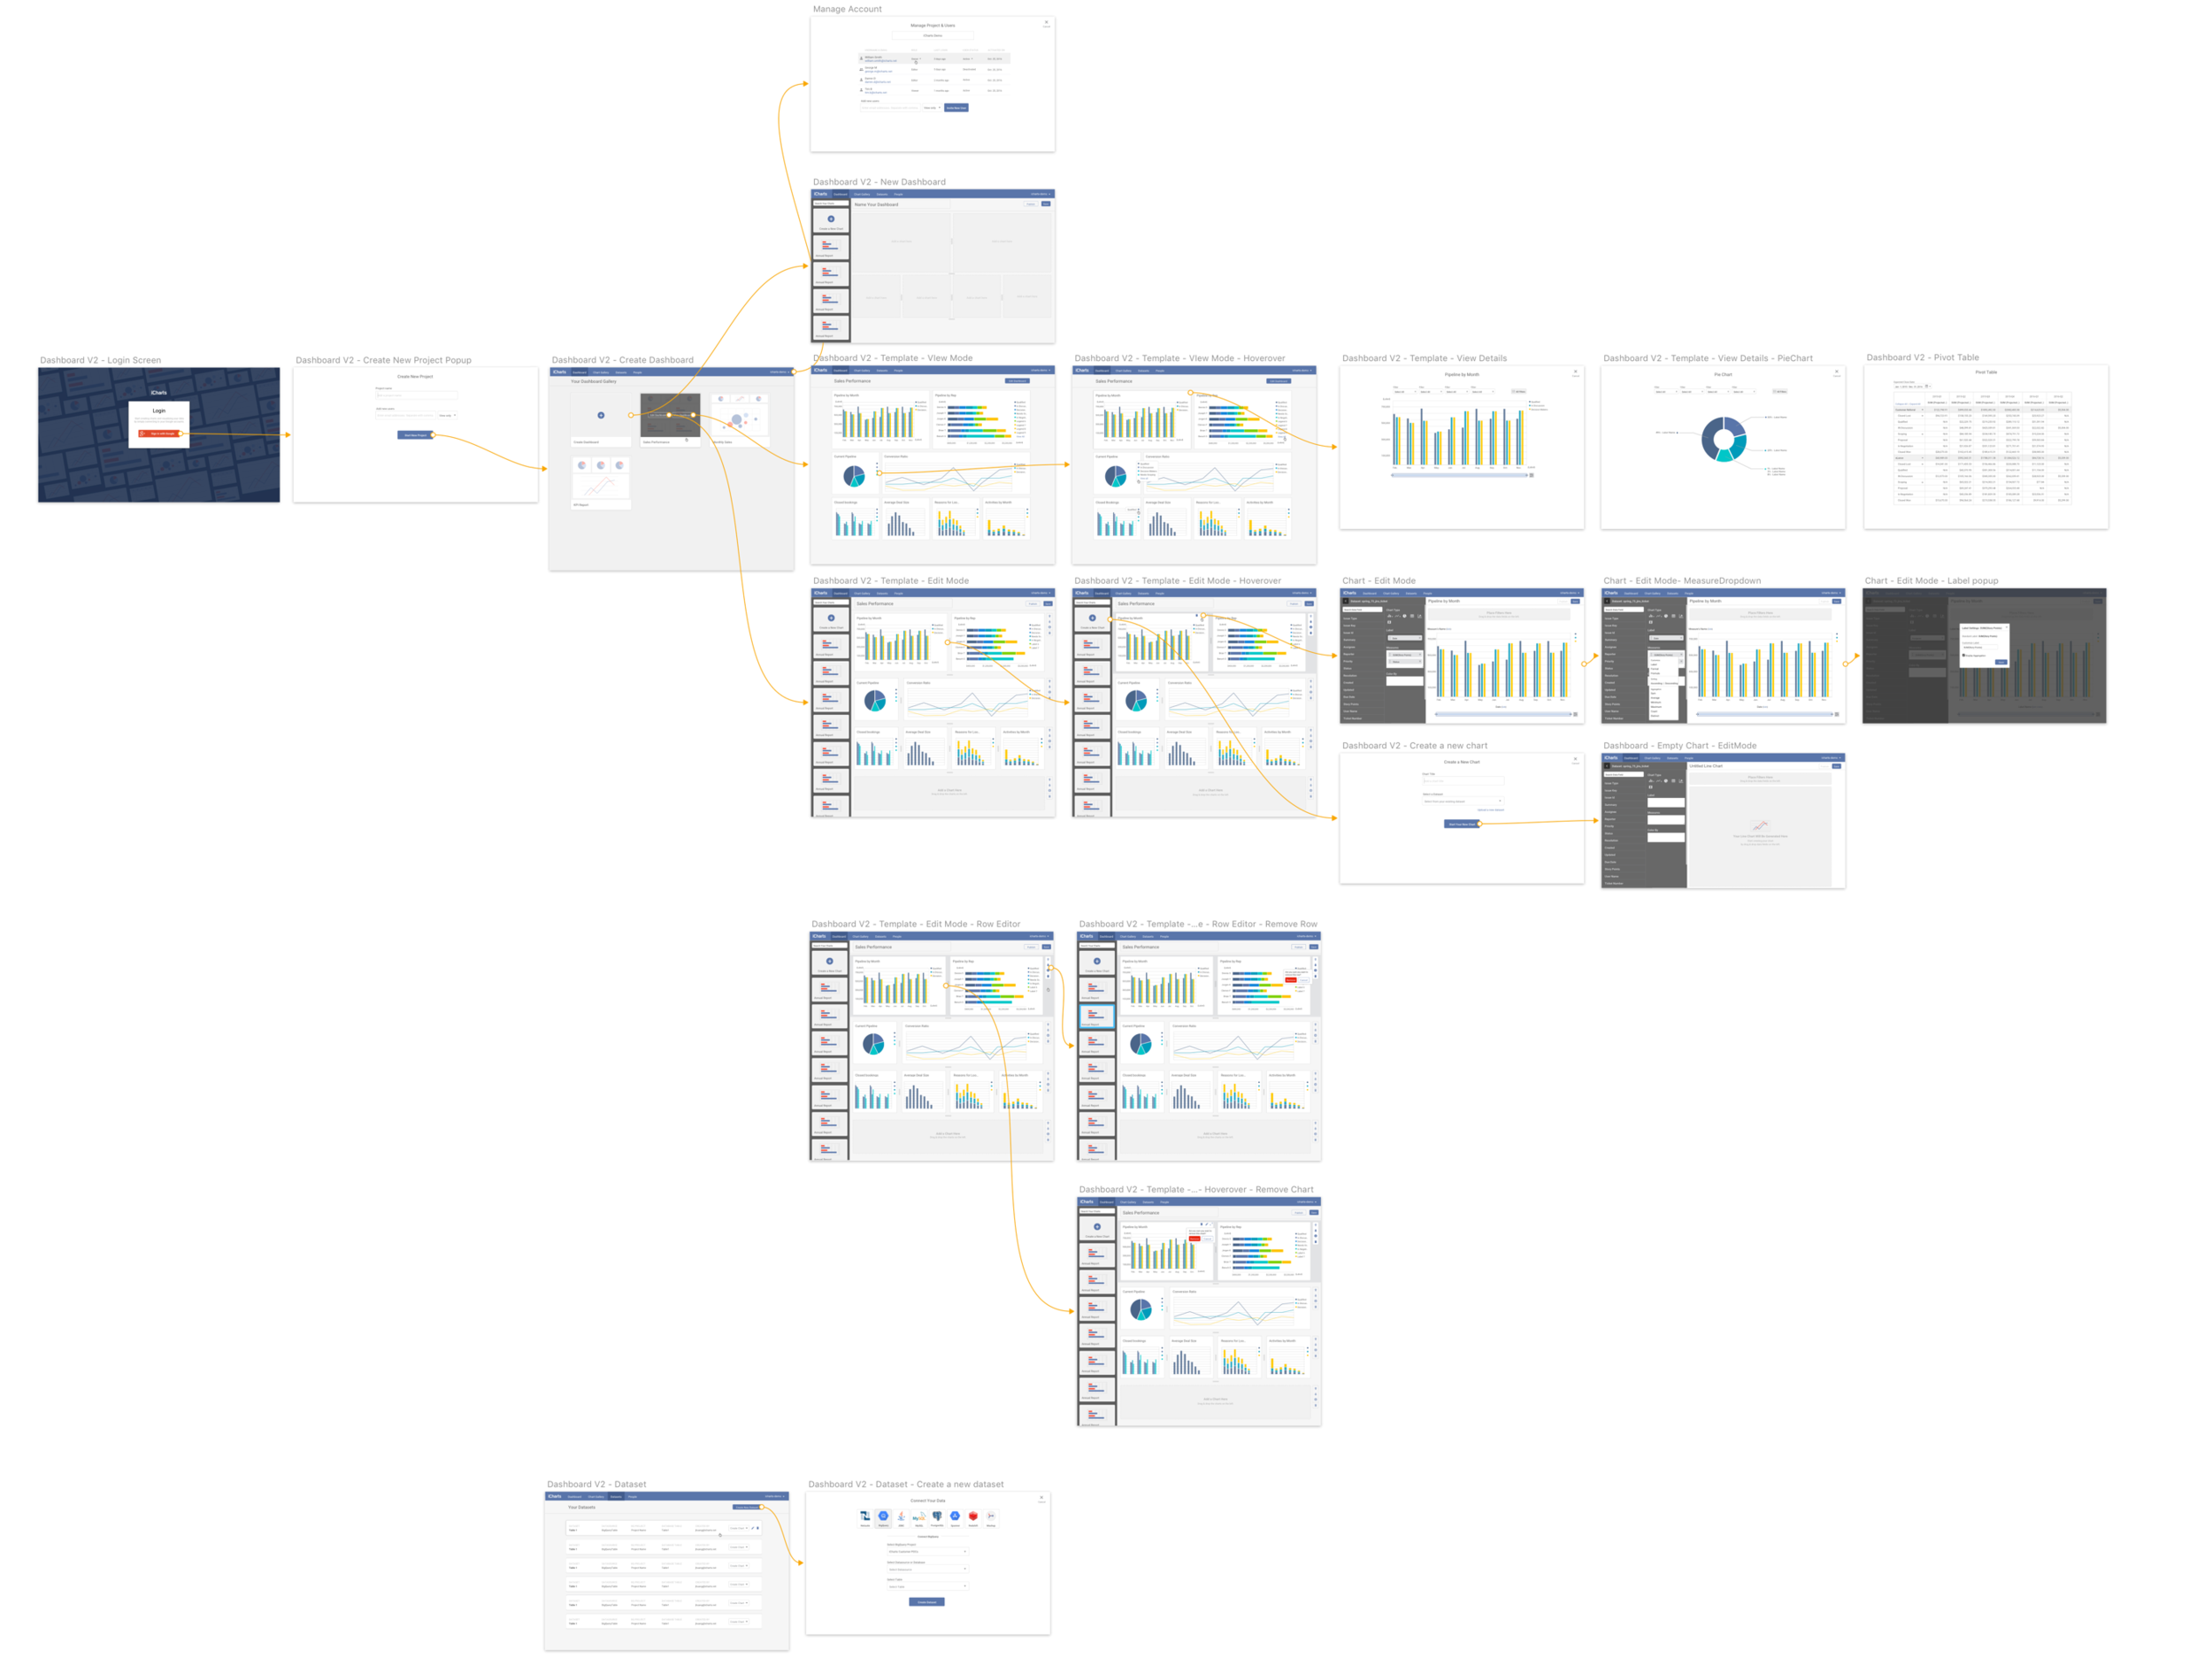
After defining a few major UI elements, I started looking at this product in a more holistic view by redesigning the entire end to end user flow from user signup to connecting datasets, as well as creating new dashboards and customized charts.
____

New Product Dashboard
A new concept of charts dashboard where users could manage multiple charts by drag-and-drop the charts into a single board. It helps users monitor the sales performance in a holistic view. Users could easily customize and rearrange the charts.
____

Customized Charts with Filters
____

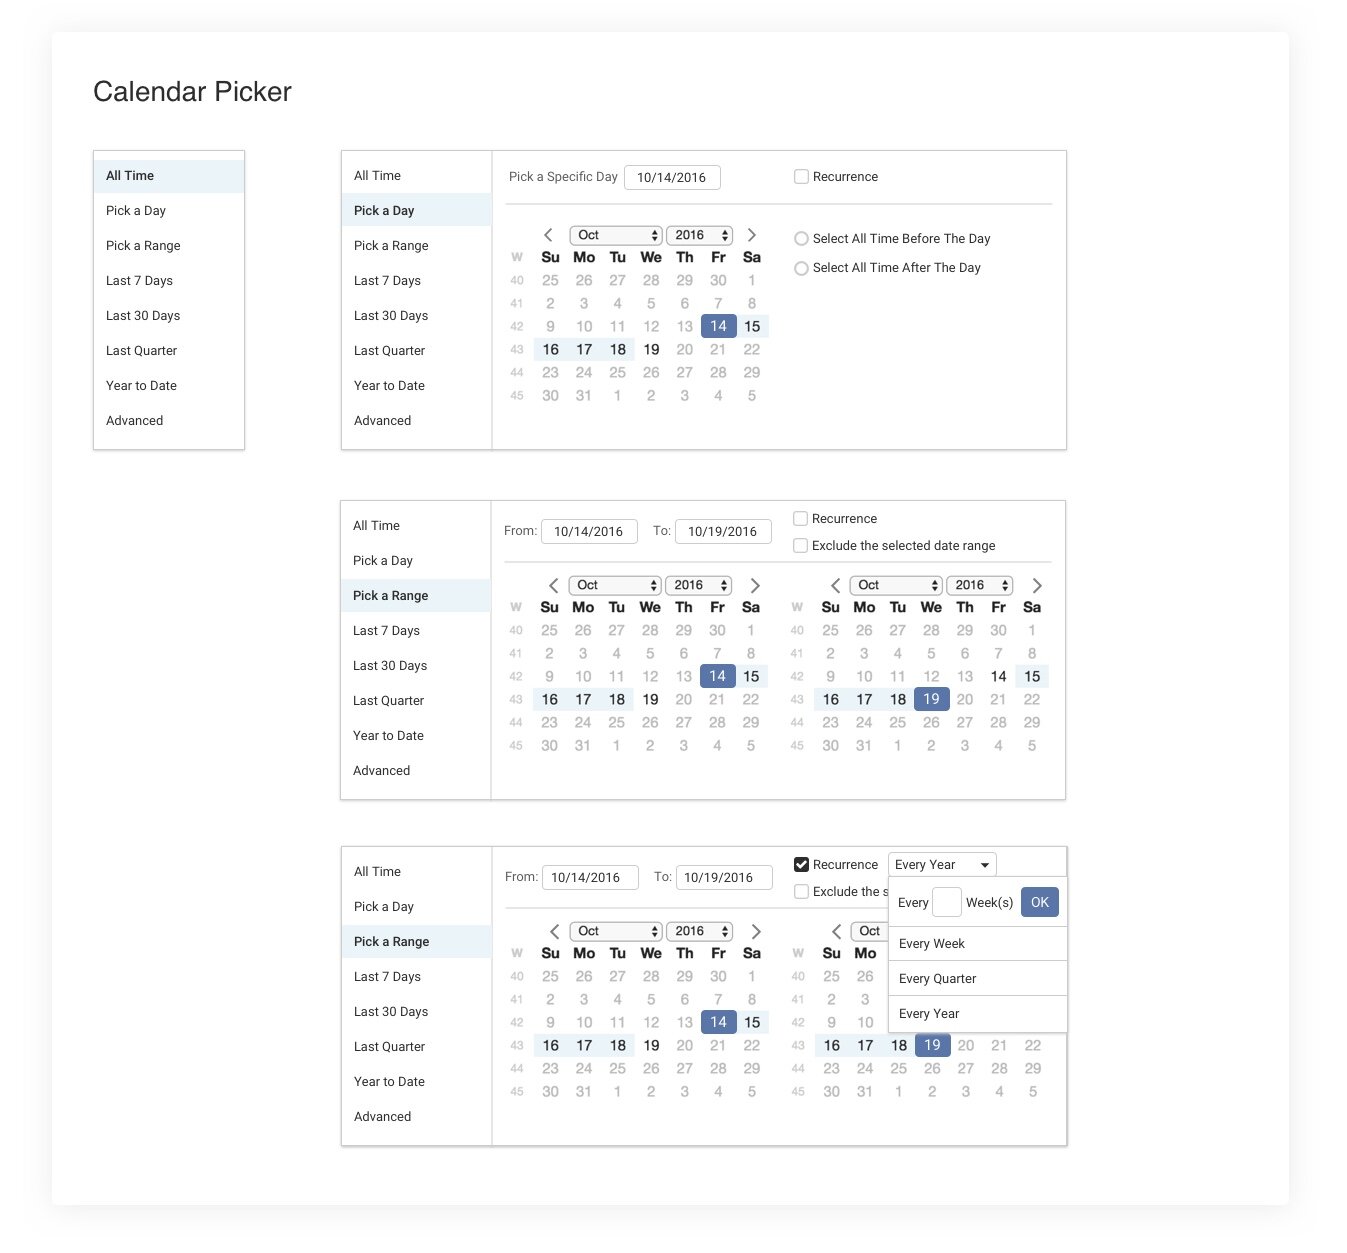
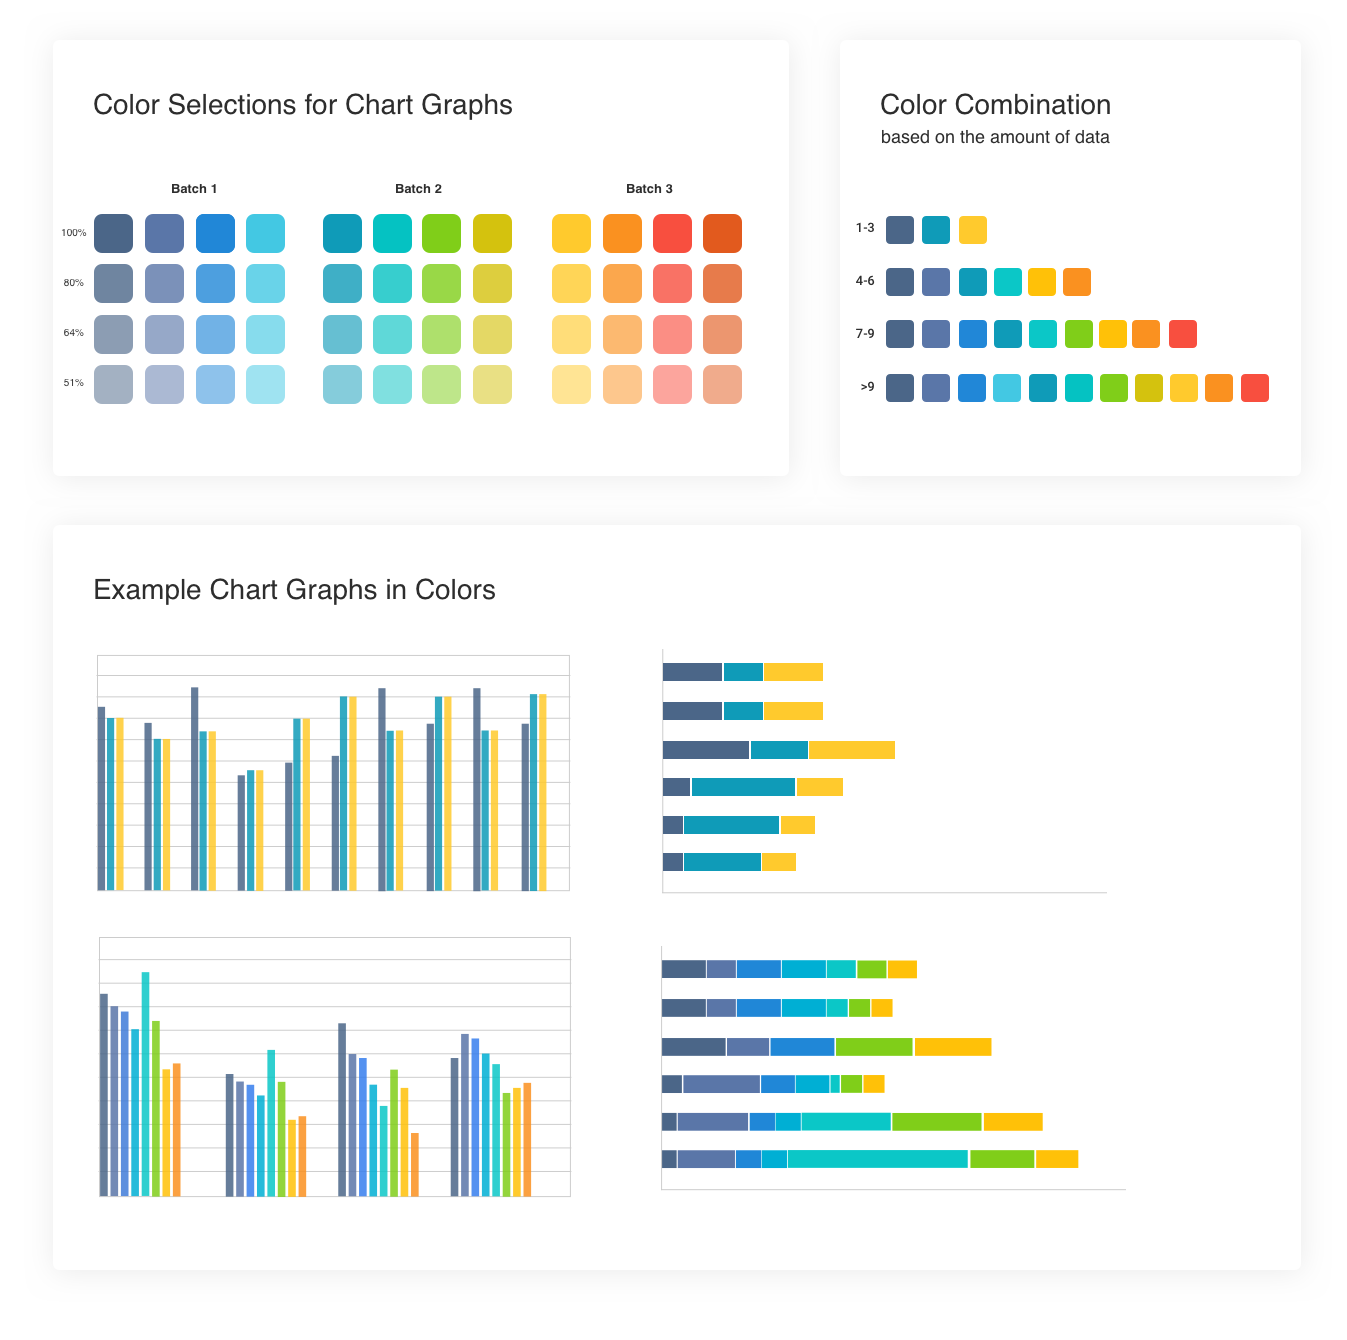
UI Elements
____


